Attributes and classifications of your point clouds
The GEO4X platform allows you to finely customize the display of your point clouds to better analyze, present, or integrate them into your projects. The Appearance menu offers several tabs to adjust the environment, points, light, and more. Here we focus on the "Attribute" tab.
Available attributes and uses
🎨 RGBA
Displays the actual colors of the point cloud (from the images).
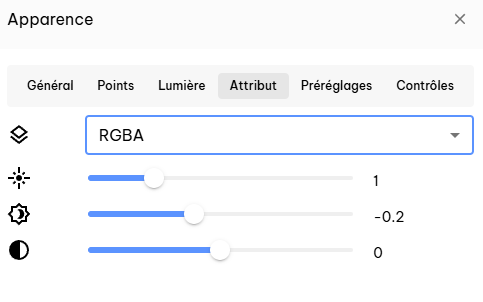
Common uses:
- Visual inspection
- Realistic rendering
- Customer communication and presentation
⛰️ Elevation
Coloring of points based on their elevation.
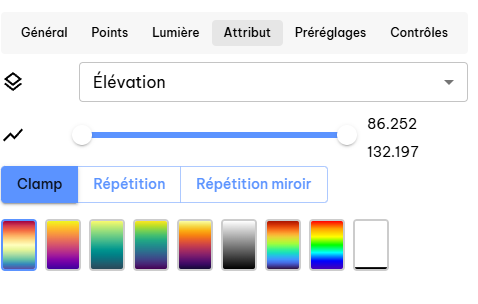
Altitude range
The two sliders define the minimum and maximum altitudes used for coloring.
The palette is distributed only between these two values.
Clamp
Default mode.
-
Out-of-range values clipped
-
Simple and readable relief reading
👉 Recommended for most uses.
Repetition
The color palette repeats in a loop based on altitude.
- Highlights subtle variations
Mirror repetition
Identical to repetition, with the palette inverted at each cycle.
- Smoother transitions
- More continuous visual reading
- Useful for displaying contour lines
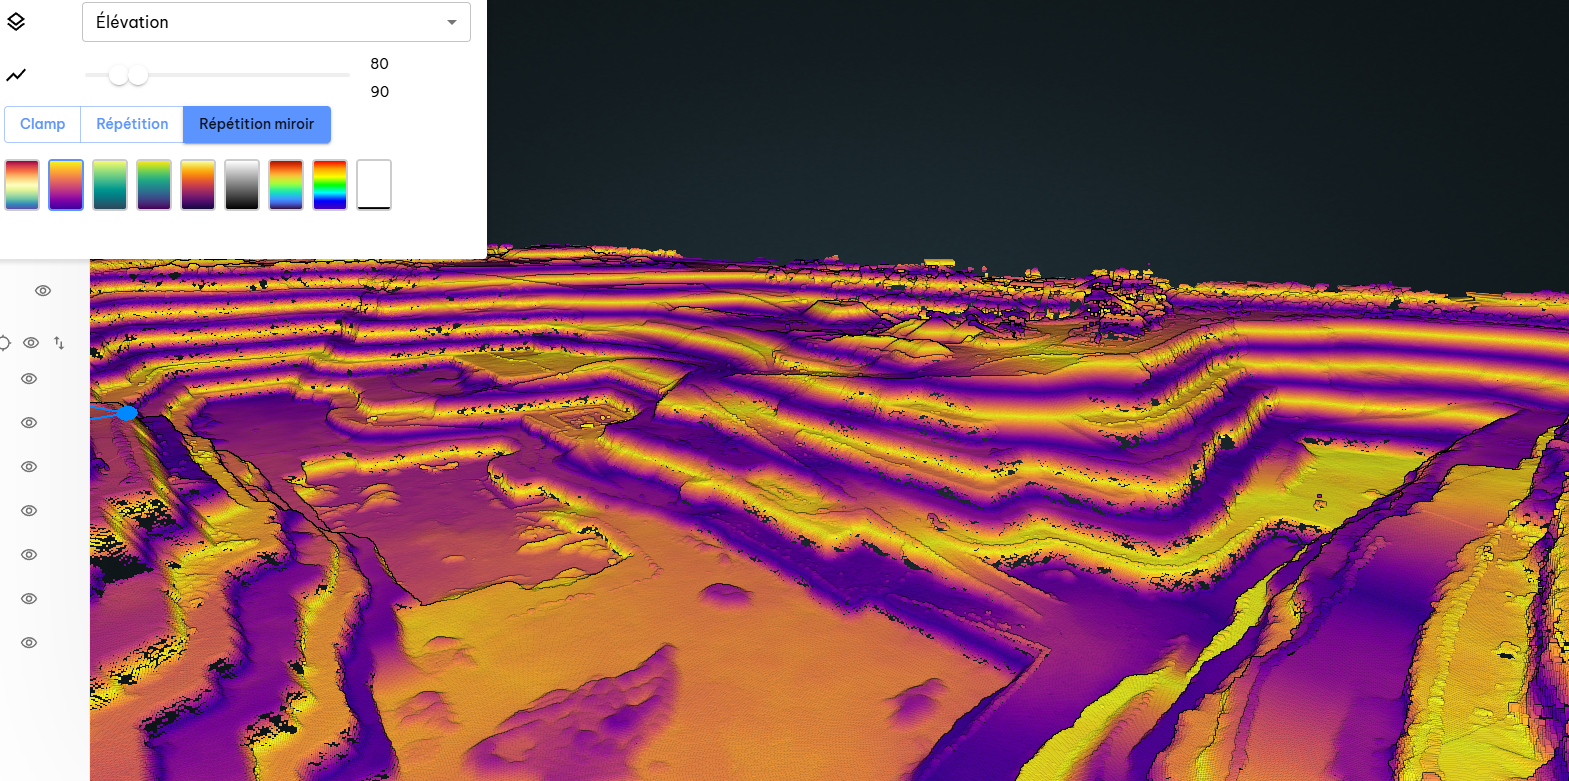
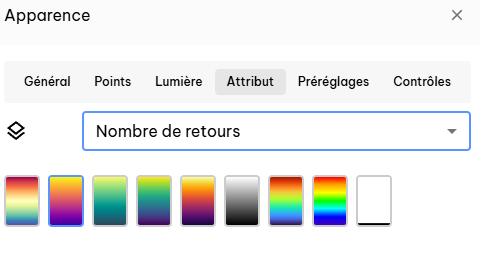
Palettes
The choice of palette only changes the display of an attribute (not the data).
Choose simple palettes for clear field reading.
Common uses:
- Reading the terrain
- Quick understanding of slopes
- Visual analysis of volumes
🏷️ Classification
Displays points according to their semantic class (ground, vegetation, buildings, etc.).
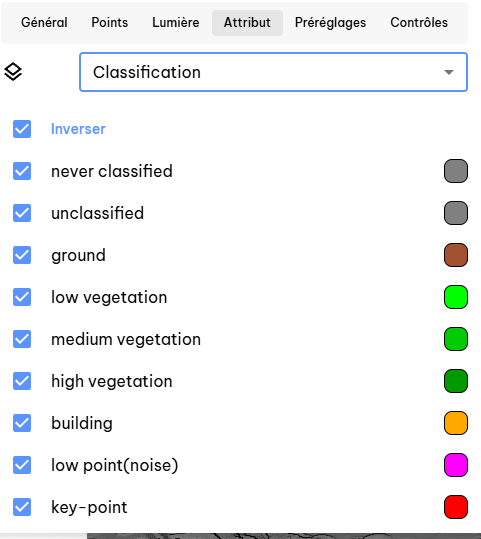
Common classes:
- Soil
- Low/medium/high vegetation
- Buildings
Common uses:
- Visually isolate the ground
- Ignore parasitic vegetation
- Quick reading of an industrial site or quarry
⚠️ Classification depends on upstream processing (photogrammetry or LiDAR). GEO4X displays the classes present in the file.
🔁 LiDAR returns and intensity
The Return Number and Number of Returns attributes allow you to analyze how the LiDAR beam interacts with the environment
(vegetation, ground, structures).
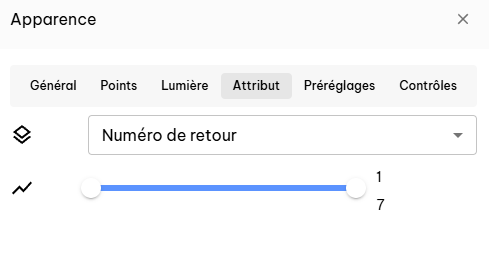
Return Number
Indicates the rank of the return for each point (1st, 2nd, 3rd, etc.).
- Low returns → high objects (vegetation, structures)
- Last returns → ground
The slider allows you to filter points by return number.
Number of returns
Indicates how many returns were recorded for the LiDAR pulse.
- High values → penetrating areas (vegetation)
- Low values → hard or open surfaces
Filter use
Both attributes act as filters:
- Changes to them are persistent and their filtering remains apparent when the attribute changes
Common uses:
- Isolate the ground (latest returns)
- Identify vegetation (multiple returns)
- Understanding the vertical structure of a site
🌗 LiDAR intensity
The Intensity attribute displays the power of the LiDAR signal reflected by each point.
It depends on the material, the angle of incidence, and the distance to the sensor.
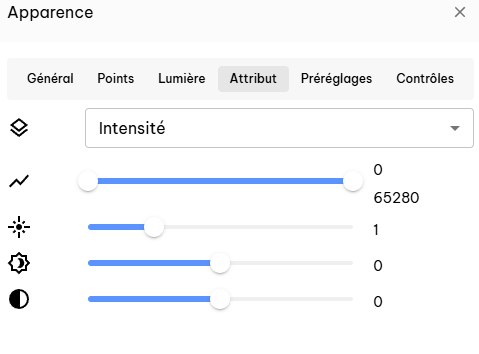
🌗 Intensity
- High values correspond to highly reflective surfaces
- Low values indicate absorbent or distant surfaces
- The slider allows you to restrict the intensity range displayed
Common uses:
- Differentiate materials (ground, roads, roofs)
- Highlight structures that are difficult to see in RGB
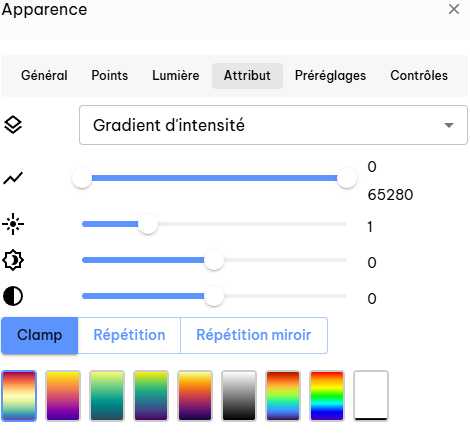
🌈 Intensity gradient
The Intensity Gradient applies a color palette to intensity values, as with elevation.
- Clamp: simple clipping, direct reading
- Repetition: accentuates subtle variations
- Mirror repetition: smoother transitions
👉 The logic (range, palettes, repeats) is identical to that of the Elevation mode, but applied to intensity.
🆔 Source ID
Identifies the source of the point (flight path, sensor, passage).
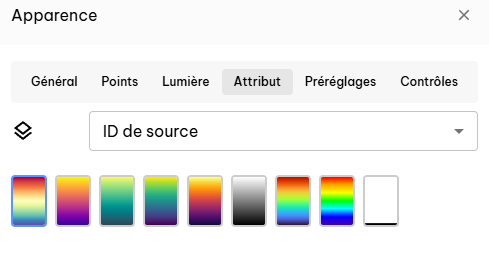
Common uses:
- Quality control
- Multi-flight or multi-sensor analysis
🔍 Level of detail
Views the resolution level/LOD used for display.
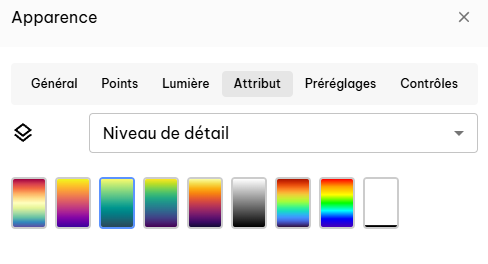
Common uses:
- Understand the density displayed
- Check visualization quality at different distances
🧩 Composite (advanced attribute mix)
The Composite attribute allows you to display several attributes of a point cloud simultaneously in a single menu.
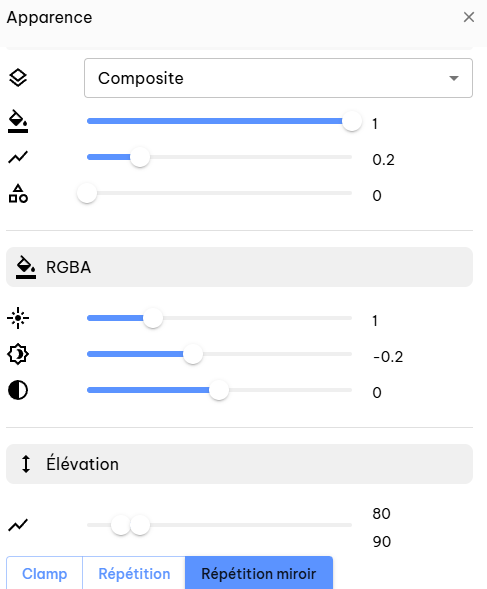
How it works
Each attribute available in Composite (RGBA, Elevation, Classification, etc.) has a weight slider.
This weight corresponds to:
the visual importance of the attribute relative to the others
- Weight = 0 → the attribute is not taken into account
- Weight = 1 → the attribute is fully visible
- Intermediate value → the attribute is partially visible
The displayed rendering is therefore a weighted combination of all active attributes.
In Composite mode, all of the following attributes (depending on the data available in the file) are found in a single panel:
- RGBA: actual colors of the point cloud
- Elevation: color gradient according to altitude
- Classification: ground, vegetation, buildings, etc.
✅ Best practices
- For quick business reading, prioritize:
- Classification
- Elevation
- For client presentations:
- RGBA
- If an attribute has no visible effect:
- Check that the information is present in the source file.